Your doctor mentions your BMI at every checkup. Health apps ask for it. Insurance companies factor it in. Yet most people have no idea how the number is actually calculated — or what it really tells you (and what it doesn't). Here's the full picture: the formulas, the charts, the limitations, and how to make the number useful rather than anxiety-inducing.
The BMI Formula (Metric and Imperial)
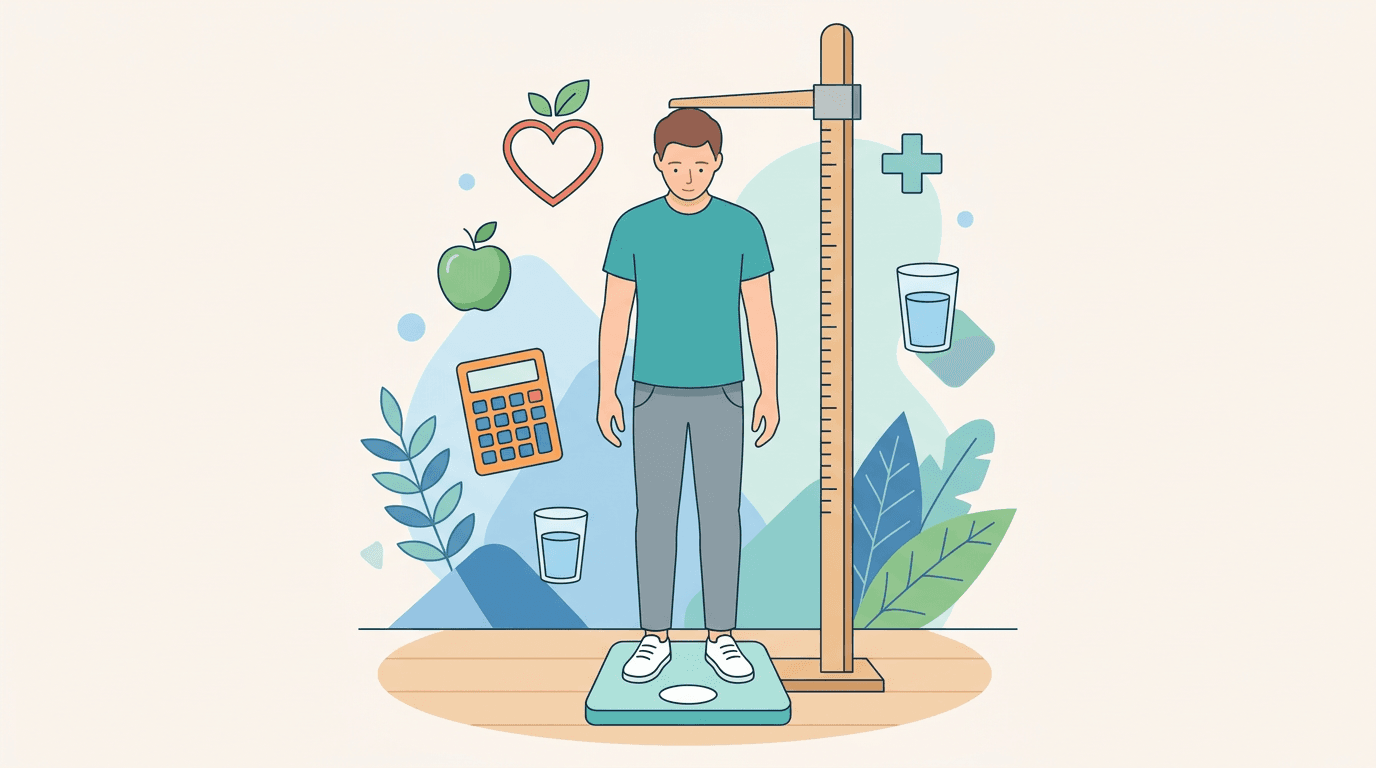
BMI stands for Body Mass Index. It's a ratio of your weight to your height squared. That's it — no blood tests, no body scans, just two numbers and some basic math.
Metric Formula (kg and cm)
BMI = weight (kg) / height (m)^2
Let's walk through an example. Say you weigh 72 kg and stand 170 cm tall:
- Convert height to meters: 170 / 100 = 1.70 m
- Square the height: 1.70 x 1.70 = 2.89
- Divide weight by that number: 72 / 2.89 = 24.9
A BMI of 24.9 lands right at the upper edge of "normal weight."
Imperial Formula (lbs and inches)
BMI = (weight (lbs) / height (in)^2) x 703
The 703 is a conversion factor that adjusts for the difference between metric and imperial units. Here's an example for someone who weighs 165 lbs and is 5'10" (70 inches):
- Square the height: 70 x 70 = 4,900
- Divide weight by that number: 165 / 4,900 = 0.03367
- Multiply by 703: 0.03367 x 703 = 23.7
Both formulas give you the same result for the same person — they're just adjusted for different measurement systems.
Don't want to do the math by hand? Use our BMI Calculator to get your number instantly.
BMI Categories and What They Mean
The World Health Organization defines four primary BMI categories:
| BMI Range | Category | What It Signals |
|---|---|---|
| Below 18.5 | Underweight | Potential nutritional deficiency, higher risk of osteoporosis and immune dysfunction |
| 18.5 – 24.9 | Normal weight | Statistically lowest risk for weight-related health conditions |
| 25.0 – 29.9 | Overweight | Increased risk for cardiovascular disease, type 2 diabetes, and hypertension |
| 30.0 – 34.9 | Obese (Class I) | Significantly elevated health risks |
| 35.0 – 39.9 | Obese (Class II) | High risk, medical intervention often recommended |
| 40.0+ | Obese (Class III) | Highest risk category, associated with severe comorbidities |
These categories are based on epidemiological data — studies of large populations that track BMI against disease outcomes. They describe statistical risk, not individual destiny. A BMI of 26 doesn't mean you're unhealthy. It means that, across thousands of people at that BMI, rates of certain conditions start to tick upward.
Doctors use BMI as a first-pass screening tool. If your number falls outside the normal range, it signals that further evaluation (blood pressure, cholesterol, blood sugar, body composition) is warranted. Think of it like a smoke detector — it tells you something might need attention, not that your house is on fire.
BMI Reference Chart by Height and Weight
Reading a formula is one thing. Seeing where you fall on a chart is often more intuitive. Below is a quick-reference table showing the BMI boundaries for common heights.
Metric Reference (kg)
| Height (cm) | Underweight (<18.5) | Normal (18.5–24.9) | Overweight (25–29.9) | Obese (30+) |
|---|---|---|---|---|
| 155 | < 44.4 | 44.4 – 59.9 | 60.0 – 71.9 | 72.0+ |
| 160 | < 47.4 | 47.4 – 63.7 | 63.8 – 76.5 | 76.6+ |
| 165 | < 50.4 | 50.4 – 67.8 | 67.9 – 81.4 | 81.5+ |
| 170 | < 53.5 | 53.5 – 71.9 | 72.0 – 86.4 | 86.5+ |
| 175 | < 56.7 | 56.7 – 76.3 | 76.4 – 91.6 | 91.7+ |
| 180 | < 59.9 | 59.9 – 80.7 | 80.8 – 96.9 | 97.0+ |
| 185 | < 63.3 | 63.3 – 85.3 | 85.4 – 102.3 | 102.4+ |
Imperial Reference (lbs)
| Height | Underweight (<18.5) | Normal (18.5–24.9) | Overweight (25–29.9) | Obese (30+) |
|---|---|---|---|---|
| 5'2" | < 101 | 101 – 136 | 137 – 163 | 164+ |
| 5'4" | < 108 | 108 – 145 | 146 – 174 | 175+ |
| 5'6" | < 115 | 115 – 154 | 155 – 185 | 186+ |
| 5'8" | < 122 | 122 – 164 | 165 – 196 | 197+ |
| 5'10" | < 129 | 129 – 174 | 175 – 208 | 209+ |
| 6'0" | < 137 | 137 – 184 | 185 – 221 | 222+ |
| 6'2" | < 144 | 144 – 194 | 195 – 233 | 234+ |
Find your height row, then see which weight column you fall into. For a precise calculation rather than an estimate from a chart, the BMI Calculator handles the math for you.
BMI for Different Populations
The standard BMI categories were developed primarily from data on European-descent adult populations. They don't apply equally to everyone.
Children and Teens
BMI in children is calculated with the same formula but interpreted differently. Instead of fixed cutoffs, pediatricians use age-and-sex-specific percentiles. A child at the 85th percentile for their age group is considered overweight; the 95th percentile and above is obese. The CDC growth charts are the standard reference in the United States, while the WHO provides international growth charts for children under 5.
The reason for percentiles is straightforward: children's body composition changes dramatically as they grow. A BMI of 22 means something completely different for an 8-year-old than for a 35-year-old.
Older Adults
Research from the Journal of the American Geriatrics Society and other sources suggests that the "ideal" BMI range for older adults (65+) may be slightly higher than the standard 18.5–24.9. Several studies have found that BMI values between 23 and 30 are associated with the lowest mortality rates in this age group. Being slightly "overweight" by standard definitions may actually be protective in older age, providing reserves during illness or recovery from surgery.
Asian Populations
The WHO has proposed lower BMI cutoffs for Asian populations based on data showing that health risks — particularly type 2 diabetes and cardiovascular disease — begin to increase at lower BMI values compared to European populations. The suggested cutoffs:
| Category | Standard Cutoff | Asian Cutoff |
|---|---|---|
| Overweight | 25.0+ | 23.0+ |
| Obese | 30.0+ | 27.5+ |
Countries like Japan, China, and Singapore have adopted these adjusted thresholds in clinical practice. If you're of Asian descent, these modified ranges may be more relevant to your health assessment.
Pregnant Women
BMI should not be used to evaluate weight during pregnancy. Pre-pregnancy BMI is used instead to guide recommended weight gain during pregnancy (the Institute of Medicine provides specific guidelines based on pre-pregnancy BMI category). But calculating BMI while pregnant is meaningless — the weight of the fetus, placenta, amniotic fluid, and increased blood volume all distort the number.
What BMI Gets Wrong
BMI was invented in the 1830s by a Belgian mathematician named Adolphe Quetelet. He was studying population statistics, not individual health. The formula was never designed as a personal health diagnostic — it was a tool for analyzing trends across large groups of people. That context matters.
Here's where BMI falls short as an individual measure:
It can't distinguish muscle from fat. This is the most frequently cited limitation, and it's legitimate. A 6'0", 220-pound rugby player and a 6'0", 220-pound sedentary office worker both have a BMI of 29.8 — "overweight" — but their health profiles are worlds apart. The formula treats all weight the same.
It ignores where fat is stored. Two people with identical BMIs can have very different health outcomes depending on fat distribution. Visceral fat (stored around the organs in the abdominal cavity) is far more metabolically dangerous than subcutaneous fat (stored under the skin). Someone with a normal BMI but high visceral fat — sometimes called "skinny fat" or metabolically obese normal weight (MONW) — can face real cardiovascular and metabolic risk.
It doesn't capture metabolic health. You can have a BMI of 27 and perfect blood pressure, blood sugar, and cholesterol. You can also have a BMI of 23 and already be insulin resistant. BMI gives you no information about metabolic markers. A 2016 study published in the International Journal of Obesity found that nearly half of people classified as "overweight" by BMI were metabolically healthy, while over 30% of "normal weight" individuals had unhealthy metabolic profiles.
It varies by frame size and ethnicity. People with larger bone structures naturally weigh more. And as discussed above, the relationship between BMI and health risk differs across ethnic groups.
None of this means BMI is useless. It means it's one data point, not the whole picture.
Better Metrics to Use Alongside BMI
If you want a more complete picture of your body composition and health risk, combine BMI with one or more of these measures:
| Metric | What It Measures | How to Get It | Risk Thresholds |
|---|---|---|---|
| Waist circumference | Abdominal fat | Tape measure at the navel | Men: >40 in (102 cm), Women: >35 in (88 cm) |
| Waist-to-height ratio | Central obesity | Waist / height | >0.5 indicates increased risk |
| Body fat percentage | Fat vs lean mass | DEXA scan, calipers, or bioimpedance scale | Men: >25%, Women: >32% (general thresholds) |
| Waist-to-hip ratio | Fat distribution | Waist / hip circumference | Men: >0.90, Women: >0.85 (WHO) |
Of these, waist circumference is the easiest to measure at home and one of the strongest predictors of metabolic disease. If you do nothing else, grab a tape measure. Measure around your waist at the level of your navel while standing, without sucking in your stomach. If you're above the threshold for your sex, that's a more actionable signal than your BMI alone.
Body fat percentage is the gold standard for understanding body composition, but accurate measurement requires equipment — a DEXA scan or hydrostatic weighing. Consumer-grade bioimpedance scales can give a rough estimate, but their accuracy varies by 3–5 percentage points depending on hydration and other factors.
How to Use Your BMI Result
BMI is most useful as a starting point, not an endpoint. Here's a practical approach:
If your BMI is in the normal range (18.5–24.9): You're likely in good shape from a weight perspective, but don't ignore other markers. Measure your waist circumference to rule out the "skinny fat" scenario, and keep up with regular health screenings.
If your BMI is in the overweight range (25–29.9): Don't panic. Check your waist circumference and, if possible, get your metabolic markers tested (blood pressure, fasting glucose, lipid panel). If those are fine and you're physically active, your weight may be perfectly healthy. If markers are elevated, even a modest 5–10% weight loss can significantly improve them.
If your BMI is 30 or above: This is where the statistical risk becomes hard to ignore. Talk to your doctor. Get a full metabolic workup. And if you decide to pursue weight loss, focus on sustainable changes rather than crash dieting — a calorie deficit of about 500 calories per day leads to roughly 1 pound of weight loss per week. Our Calorie Calculator can help you figure out your daily energy needs as a starting point.
If your BMI is below 18.5: Being underweight carries its own serious risks, including weakened immune function, bone loss, and fertility issues. If you're consistently below 18.5 and aren't intentionally at that weight through athletic training, consult a healthcare provider.
The bottom line: know your number, understand its context, and pair it with other data before drawing conclusions.
Frequently Asked Questions
What is the ideal BMI for adults?
The World Health Organization considers a BMI between 18.5 and 24.9 to be "normal weight," which is associated with the lowest statistical risk of weight-related health problems. However, this is a population-level guideline — individual health depends on many factors beyond BMI, including body composition, fitness level, and metabolic markers.
Is BMI or body fat percentage more accurate?
Body fat percentage is a more accurate measure of body composition because it distinguishes between fat mass and lean mass (muscle, bone, water). BMI treats all weight equally, so a muscular person and an overfat person of the same height and weight get the same score. The trade-off is accessibility: BMI requires only a scale and a tape measure, while accurate body fat measurement requires specialized equipment like a DEXA scan.
Can muscular people ignore their BMI?
Not exactly. If you carry significant muscle mass and have a BMI in the "overweight" range, the number likely overstates your health risk. But you shouldn't dismiss it entirely. Some research suggests that carrying extra weight — even as muscle — can increase load on the cardiovascular system over time. Use waist circumference and metabolic markers alongside BMI for a more complete assessment.
How often should you check your BMI?
For most adults, checking BMI once or twice a year is sufficient. It's a slow-moving number — daily or weekly checks aren't meaningful because short-term weight fluctuations (from water retention, food timing, etc.) don't reflect real changes in body composition. If you're actively working on weight management, weigh yourself weekly and calculate BMI monthly.
Is BMI calculated differently for children?
The formula is the same (weight divided by height squared), but interpretation is different. Children and teens are evaluated using age-and-sex-specific BMI percentile charts rather than the fixed adult cutoffs. A child at the 85th–94th percentile is considered overweight, and at or above the 95th percentile is considered obese. These percentiles account for the normal growth and body composition changes that happen during development.